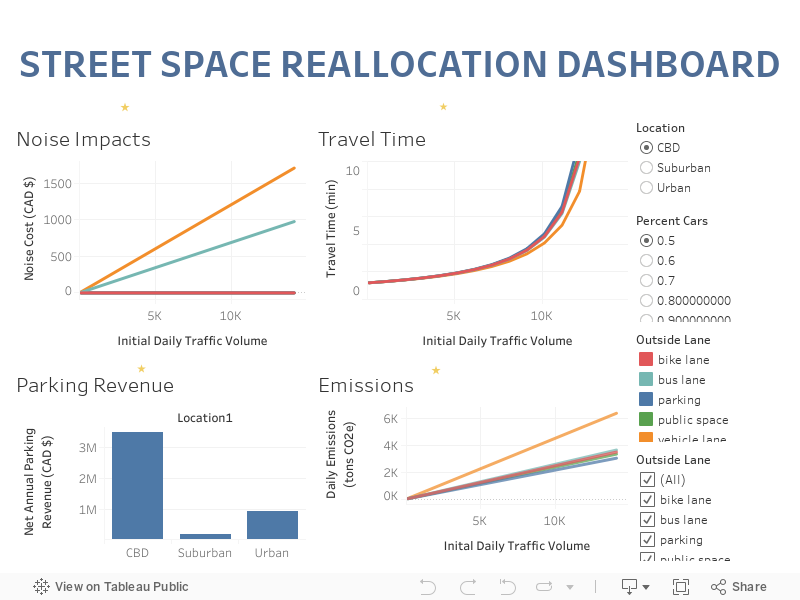
Streets serve many masters: pedestrians, cyclists, drivers, people using wheelchairs, delivery vehicles, transit buses, and more. But streets are flexible: they can be adapted to better suit local contexts. For example, during COVID-19, lower vehicle volumes have revealed empty pavement that could better be used as wider sidewalks, restaurant patios, or new public spaces. To better understand this potential, UBC Smart City has created a road space reallocation dashboard that explores some of the many factors, tradeoffs, and outcomes of projects that change how street space is used.
The team wrote a Python script to calculate these impacts, which are presented in an interactive Tableau visualization. The program considers a standard, 4-lane road with one travel lane and one parking lane in each direction. It compares this layout with four different uses for the parking lanes: general travel lanes, bus lanes, bike lanes, or multipurpose public space. The outcomes presented include traffic volumes, travel time, fuel emissions, noise pollution, and changes in parking revenue for the subject municipality. The results vary between different types of street environments, initial traffic volumes, and the type of vehicles on the street. The dashboard also accounts for additional traffic induced by changes in road capacity.
These impacts are difficult to quantify and highly context-specific, so the dashboard relies on estimates and generalizations. The results are inexact but should provide a reasonable comparison between options. The model is designed to allow for improvement, so next years’ team can improve the model or add a larger range of projects and outcomes to the dashboard. Ultimately, we hope this project will contribute to a better public understanding of road space reallocation projects, and how they can be used to make streets better for the communities they serve.